.png)
Price Per Square Foot Across SLO County, Town by Town

Updated: 2 days ago
You're trying to compare a three-bedroom in Grover Beach with a three-bedroom in Templeton, and the list prices are close enough that you're not sure which is the better value. So you do what most buyers do and divide the price by the square footage. Suddenly one looks like a bargain and the other looks overpriced.
Price per square foot in SLO County is the fastest way to compare homes across the county. It's also one of the easiest ways to fool yourself. This post walks through how the metric behaves town by town on the Central Coast, without quoting figures that will be out of date by the time you read them, and explains when to trust it and when to set it aside.

HIGHEST TO LOWEST
How the towns rank relative to each other
Rather than give you numbers, we'll give you the shape of the map, which changes far less than the numbers do. From highest price per square foot to lowest, SLO County tends to line up roughly like this.
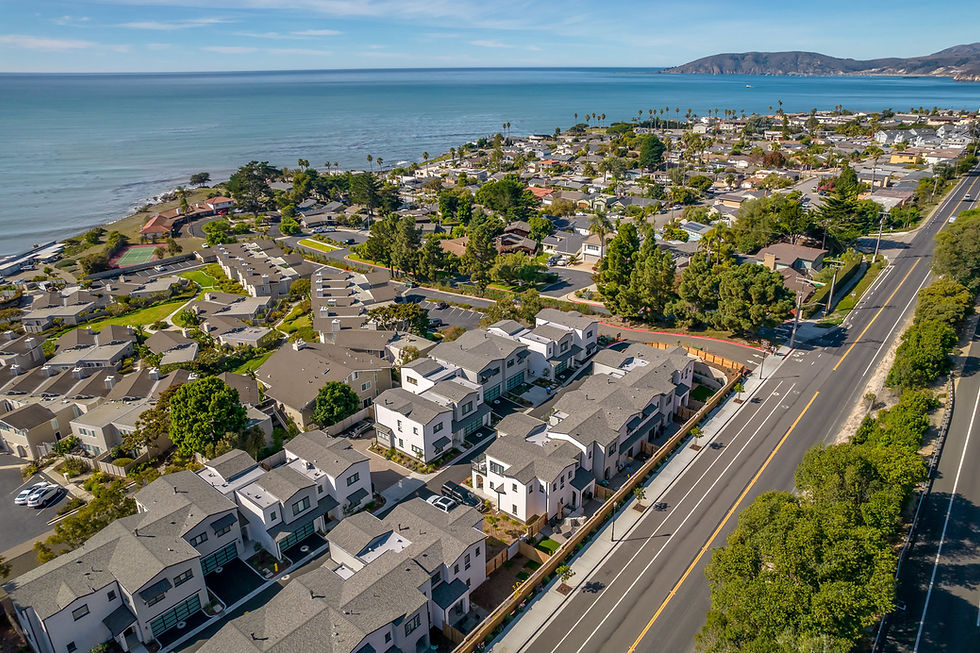
The tier at the top is the small coastal towns with bluff and beachfront property: Shell Beach, Avila Beach, Pismo Beach, and Cayucos. These towns have very little housing stock, a lot of second-home demand, and lots that command a premium for what's outside the walls rather than inside them. Small homes on great lots push the per-foot number far above anything inland.
Just below sit San Luis Obispo itself and Cambria. SLO's number is driven by steady demand and small lots; Cambria's by the coast and the pines.
The middle tier is Morro Bay, Los Osos, Arroyo Grande, and Grover Beach. These towns offer real coastal or near-coastal living at meaningfully less per foot than their neighbors, which is why they're where so many of our relocating buyers end up. Within Arroyo Grande, the Village and the older neighborhoods run higher than the Mesa on a per-foot basis; within Morro Bay, north of the harbor generally runs lower than the hillside neighborhoods with views.
Below that come Nipomo, Oceano, and Templeton, where you start trading per-foot cost for lot size and newer construction.
The lowest tier is North County proper: Atascadero, Paso Robles, Santa Margarita, San Miguel, and the rural areas around Creston and Lake Nacimiento. Bigger homes, bigger lots, and the most house for the money anywhere in the county.
If you want the current figures behind this ranking, ask us. We keep them updated and are happy to share, but they belong in a conversation, not a post that will outlive them.

LAND IS DOING MOST OF THE WORK
Why the metric misleads on the Central Coast
Price per square foot is designed for a world where homes are roughly similar and land is roughly interchangeable. SLO County is neither.
Land is doing most of the work. In the coastal towns, the price of a home is mostly the price of the dirt underneath it. A small cottage on a bluff in Shell Beach will show a per-foot number that looks absurd, because you're dividing an ocean-view lot by a tiny house.
Add a second story and the per-foot number drops sharply without the home getting any worse. This is why the metric flatters big houses and punishes small ones in coastal markets.
Big lots are invisible. A home on five acres in Templeton and the same home on a quarter acre in Templeton will show similar per-foot numbers if their prices are similar, even though one comes with land that has real value. The metric ignores the acreage entirely. Our post on buying acreage in North County is really a whole essay on this problem.
Square footage is soft. Counties, appraisers, and listing agents don't always agree on what counts. Finished basements, converted garages, sunrooms, and ADUs are treated inconsistently. Two listings can report the same square footage and differ by hundreds of actual usable feet.
Condition and era aren't captured. A remodeled mid-century home in SLO and an untouched one next door might carry very different per-foot numbers, and the gap is entirely explained by what's inside, not what the metric measures.
Views aren't captured either. In Pismo Beach, Cayucos, or the hills of Morro Bay, a whitewater view can be worth more than an extra bedroom, and it shows up as a "high" per-foot number rather than a distinct line item.
SIMILAR HOMES, SAME NEIGHBORHOOD
When price per square foot is genuinely useful
We're not telling you to ignore it. We use it constantly, but in specific ways.
Comparing similar homes in the same neighborhood. Two tract homes in the same Nipomo subdivision, built the same year, on similar lots. Here the metric is excellent, because everything it ignores is roughly equal.
Spotting a home that's priced against the wrong comps. If a listing's per-foot number is far outside the range of the last several closings in its neighborhood, it's either priced with something else in mind or it's mispriced. Either way, it's worth a closer look.
Sanity-checking an appraisal. Appraisers use per-foot adjustments, and knowing the neighborhood range helps you understand whether a low appraisal is defensible. We cover what to do about a low number in appraisal gaps.
Understanding how value scales. In most SLO County neighborhoods, per-foot value falls as size rises. The first bedroom is worth the most; the fifth is worth the least. That's useful when you're deciding whether to buy bigger or buy better-located.
GROVER BEACH · TEMPLETON
A worked comparison, without numbers
Take that Grover Beach versus Templeton question from the top. The Grover Beach home will almost certainly show a higher per-foot number. Does that make it overpriced? Not necessarily.
What you're paying for in Grover Beach is proximity to the ocean, a mild climate, and land that can't be replaced. What you're paying for in Templeton is space, a newer or larger home, and a lot you can actually use.
The right question isn't "which per-foot number is lower?" It's "which of these things am I actually buying, and is the premium for the coastal one worth it to me?" Our post on how much house your budget buys in each SLO County town is built around exactly that trade-off.
Price per square foot tells you what the walls cost. On the Central Coast, you're rarely just buying the walls.

LOT · VIEW · CONDITION · LOCATION
What to do with all this
If you're a buyer, use per-foot as a first filter and then set it down. Compare homes on the things the metric can't see: lot, view, condition, location within the town, and what it would cost to replace what you're getting.
If you're a seller, expect buyers to run the calculation, and be ready with a story for why your home's number sits where it does. If it's higher than the neighborhood, the lot or the view or the remodel had better justify it, and the listing should make that case explicitly.
Your next step
Tell us the two or three towns you're weighing and the kind of home you're looking for, and we'll send you the current price-per-square-foot ranges for each, along with the context that explains the gaps. That comparison, with the real numbers and the real caveats, is the fastest way to figure out where your budget goes furthest in San Luis Obispo County. You can also browse our current listings to see how the ranges play out in actual homes.

Talk With Kim & Kristen
We are Kim San Jule and Kristen Gentry, Broker Associates with Real Broker, serving San Luis Obispo County and the Central Coast. Whether you are buying, selling, or simply thinking ahead, we are glad to be a resource.
Kim San Jule · Broker Associate, DRE 01948144 · 805-345-8303 · kimsanjule@gmail.com
Kristen Gentry · Broker Associate, DRE 01968754 · 805-441-4618 · kristengentryslo@gmail.com
Real Broker · Search Central Coast homes for sale